Overview
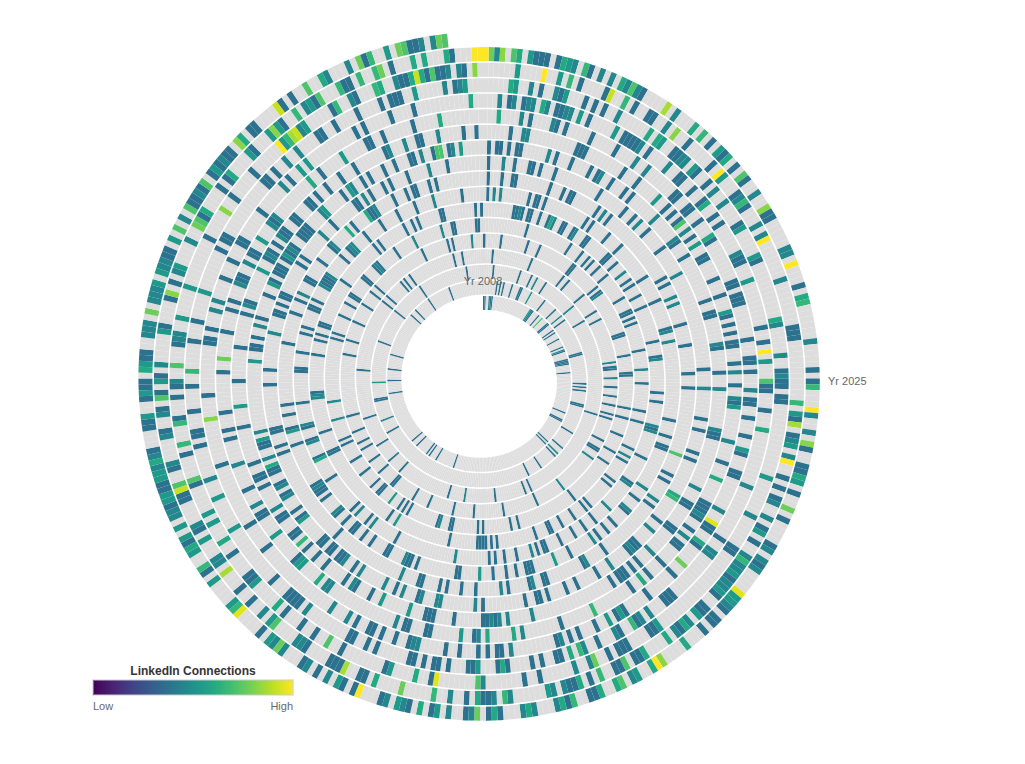
Seventeen years of LinkedIn networking data spirals outward from center to edge, each daily segment colored by connection activity. Time flows in concentric rings where career transitions appear as color shifts, revealing the hidden rhythms of professional relationship building.
Approach
The visualization employs a polarized scaling algorithm that combines logarithmic, square root, and power transformations to ensure visual variety across the spectrum of networking activity. Each ring represents one full year, with 365 daily segments creating intricate patterns.
The Viridis color palette transitions from deep purple (quiet periods) to bright yellow (intense networking activity), revealing the natural rhythms embedded within career development.
Part of Hanami
A generative code art collection exploring data as aesthetic medium.